Game mechanics - Assembly workers recruiting
22.08.2018
Starting from scenario 15C1 (also rightly for next scenarios 16C1, 17C1, etc), developers of GMC simulator added new feature with increased competition in the labor market of assembly workers. In earlier scenarios 12C1-14C3 labor market of assembly workers almost always allowed to recruit the exact number of staff specified in the decision, now it is possible to recruit 100% of the specified number only with comparative weak competition between companies in the group. The "capacity" of the labor market decreased by 2 and workers are not enough for everyone. Particularly brightly the shortage of labor market appears in the final stages of the championship, which rises intense competition between the teams even more.
On the other hand, a detailed understanding of the mechanism of workers recruiting allows to gain an additional advantage over competitors, which can become a key. Below we will consider what factors influence on workers recruiting most of all. If there is no time to read the whole text, then proceed to the hints at the end of the article.
Capacity of labor market of assembly workers
Labor market of assembly workers has limit on total recruitment for single period which is individual for each scenario. This means that if the total recruitment of all 8 companies in the group exceeds this limit, then one of the companies may recruit less assembly workers than specified in the decision (for example, the company decides to recruit 30 workers, and recruits only 15) or even do not recruit at all. Analyze the labor market capacity for each scenario separately. On the chart, each point shows ratio of the assembly workers total recruitment in the group for all companies in 1 period and number of actually recruited workers in 1 period. Red line shows 100% recruitment, above the red line number of recruited workers is lower than specified in the decision. Thus, it is possible to estimate the limit on total recruitment of workers in group for all teams.
Scenario 12C1
According to the statistics we collected, maximum number of recruited workers in the 1 period is 237 when total recruiting 250-260. Total recruitment limit for all teams in the group is 237 maximum. For example, in group of 8 teams, this corresponds to about 30 assembly workers per team, which is more than enough for a comfortable game.
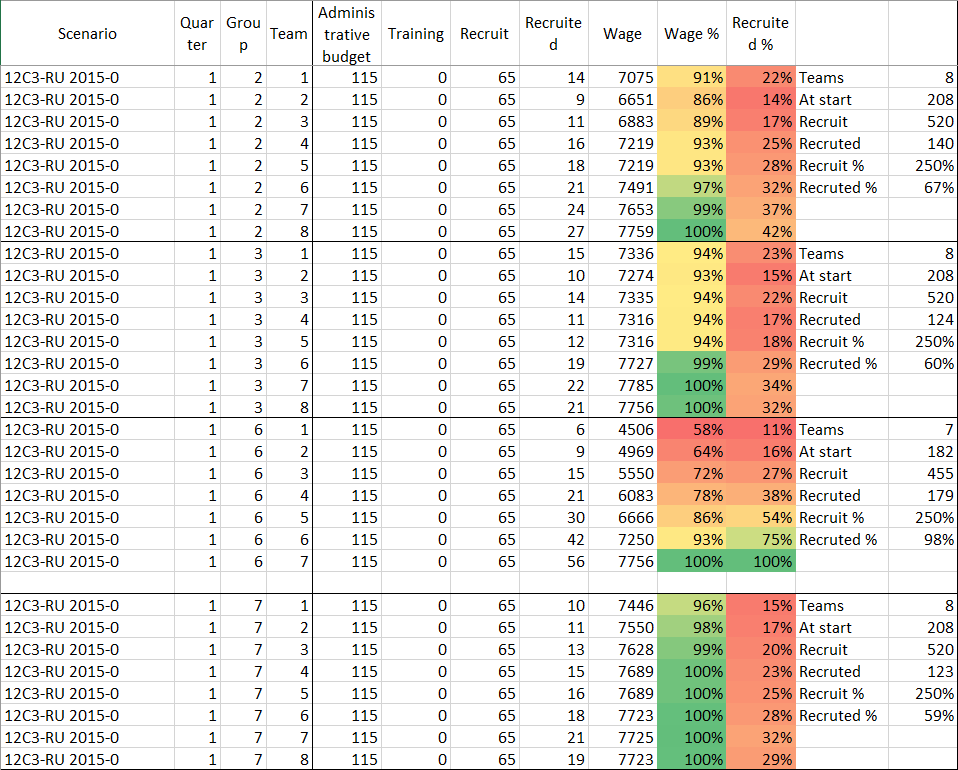
Scenario 12C3
Maximum number of recruited workers is 321 when recruiting is 501. Next results are 290 and 291 actually recruited workers. Wide range between recruited and recruiting workers is associated with a lower management budget (115 for 12C3 scenario versus 180 for 12C1 scenario), which is an important factor in calculating the number of recruited workers. However, total recruitment limit for all teams in the group is 291 maximum, which is even higher than for 12C1 scenario.
Scenario 14C1
The spread of recruited and recruiting assembly workers is about the same as for scenario 12C3. The reason is same, management budget is only 115, which is less than optimal budget (150 - 180) for the size of company that is proposed for management in this scenario. Maximum number of actually recruited workers is 215 with total recruiting in the group 262.
Scenario 14C3
Management budget is already 150 and the spread between recruited and recruiting workers is less than for scenarios 12C3 and 14C1. Also, for this scenario, large number of workers is not necessary, so maximum number of actually recruited workers according to our data is 163 with a total recruiting of 178.
Scenario 15C1
First scenario, where free space in factory is limited and in 1 period you can recruit maximum 29 assembly workers (if you do not sell machines). Maximum number of actually recruited workers is 128 when recruiting 133 and recruited 126 when recruiting 182. Obviously, the capacity of labor market (limit on single recruitment) decreased even more compared to 14C3 scenario. Default management budget is 80.
Factors of actual recruitment of assembly workers
Parameters from management reports that could affect the number of recruited workers were consolidated into database. For analysis we selected management reports with more than 1 recruited workers, but where number of actually recruited workers is less than the recruiting number (ie recruitment is less 100%) for 6 scenarios (12C1, 12C3, 14C1, 14C3, 15C1, 16C1). For this sample, calculates correlation of the number of actually recruited collectors in relation to each of the parameters (bold are factors from the management decision):
- Quarter (1 - 5)
- Group
- Team
- Management budget
- Training
- Space
- Strikes
- Recruit workers
- Train workers
- Workers at start
- Workers recruited
- Workers dismissed
- Workers left
- Workers at end
- Hourly wage
- Load
- Wage
- Wage from maximum in group, %
- Workers recruited from recruit, %
The results of the correlation analysis
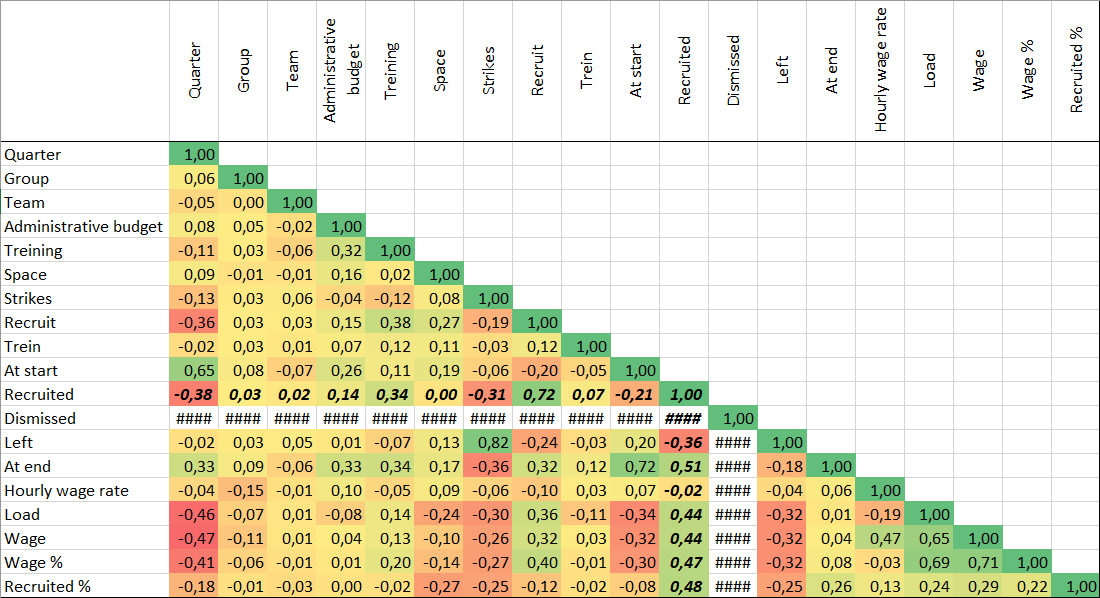
Explanations to the table:
- k > 0 - positive correlation coefficient, when the values of one variable increase, the values of the other also increase;
- k < 0 - negative correlation coefficient, when the values of one variable decrease, the other values increase;
- k > 0.70 - strong correlation;
- 0,50 < k < 0,69 - average correlation;
- 0.30 < k < 0.49 - moderate correlation;
- 0.20 < k < 0.29 - weak correlation;
- k < 0.19 - very weak correlation.
We analyzed correlation of the factors that can be specified in management decision (correlation value is in the parentheses), i.e. can be changed directly to affect the number of recruited workers:
- Management budget (0,14) - very weak correlation, but it exists, so we leave it for analysis.
- Training (0,34) - moderate correlation, much stronger influence than management budget. We leave it for analysis.
- Space (0,00) - correlation is absent, we exclude from the analysis.
- Recruiting workers (0,72) - strong correlation, but it is absolutely logical, the more specified in decision, the more recruited. We exclude from the analysis.
- Train workers (0,07) - very weak correlation, which is explained by the low using of this parameter and small share in total number of actually recruited assembly workers. We exclude from the analysis.
- Hourly wage rate (-0,02) - very weak correlation, a surprise, but wage rate does not influence on number of recruited workers. We exclude from the analysis.
- Load (0,44) - moderate correlation. Contrary to popular beliefs that forcing staff to work on weekends, you increase the risk of left workers, statistics show the opposite. At the same time, high load of workers also indicates high wages, which is the real key factor, so we exclude it from the analysis.
- Wages / Wage (0,44) - moderate correlation. The key factor that is the result of 2 components: hourly wage rate (which does not matter itself) and load of the workers. We exclude from the analysis and replace with factor Wage from the maximum in group,%, as more weighty (0,47 instead of 0,44).
Wage
Correlation is 0,47. In the result of searching for clean tests for workers recruitment, 4 complete groups were found, which allowed to determine dependence of number of actually recruited workers on wages. Other parameters of the management decision are the same.
Charts show ratio of wages to the number of recruited workers in each group (1 - 4). In the charts on the left side, OY axis shows Wage from the maximum in the group, %, and in the right side of the charts, OY axis shows rank (1 - 8) in wage level from the minimum to the maximum among companies in the group. Based on the distribution of dots relative to the trend line, it can be assumed that the GMC simulator uses wage rank of the team, when calculating number of actually recruited workers, rather than relative or absolute value of wages among teams in the group. Thus, the wage factor is calculated by rank (1 - 8) relative to competitors in the group and takes into account load of the workers and hourly wage rate.
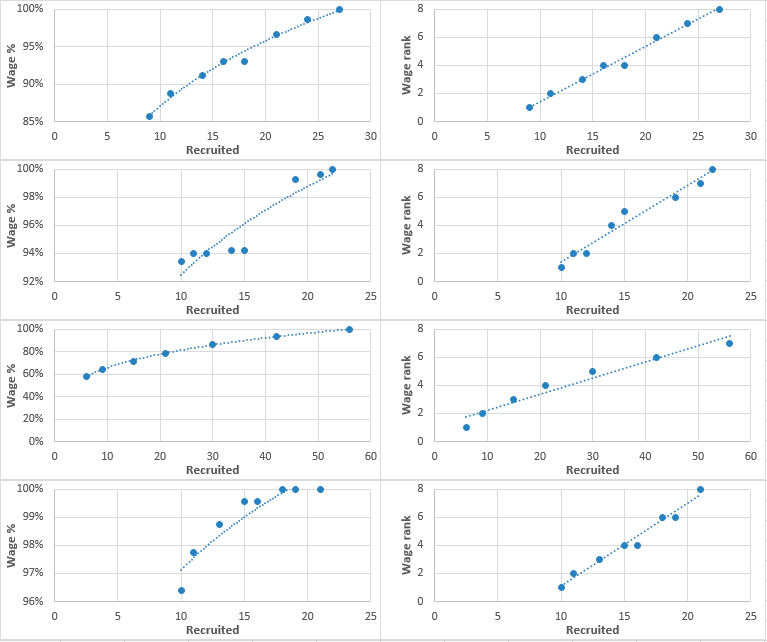
It should be noted that total number of actually recruited workers in groups varies from 123 to 179 (+46%). Also, groups are differ by average wages of the workers. The greater the difference between maximum and minimum wage among companies in the group, the more workers in total companies can recruit. Those, increased competition reduces chances of recruiting required number of workers for each company. Dependence is not direct, but it can be traced.
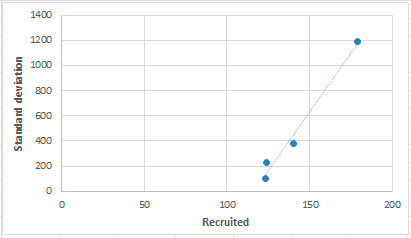
Management budget
Correlation is 0,14. Increase of management budget positively influences on chance to recruit the required number of workers. Clean tests that could demonstrate such dependence are not found in the database, therefore, chart below shows the relationship between management budget and total number of recruited workers from required for all teams, where recruiting was more than 40 workers.
Training
Increase of training has stronger influence on chance to recruit required number of workers than management budget. Chart shows relationship between training and total number of recruited workers from required for all teams, where recruiting was more than 40 workers.
Additional confirmation, this is example from international final from season 2016:
- 16C1-IF 2016-2 team 012 (France), management budget 150, training 15, average wage 8391. Recruiting 12 workers, actually recruited 3.
- 16C1-IF 2016-2 team 014 (Estonia), management budget 120, training 60, average wage 8363. Recruiting 12 workers, actually recruited 6.
With higher wage (France's rank higher than Estonia) and management budget, France actually hired only 3 workers instead of 6 in Estonia, which indicates a significant weight of training in ranking of teams for calculating recruited workers.
Recruited workers distribution
So, we found out. that GMC simulator distributes workers between companies according to above factors (management budget, training, wages). In view of the lack of clean tests for factors management budget and training, it can be assumed that, as in the case of wages, simulator ranks management budget and training in places from 1 to 8 (by number of teams in the group) and organizes all teams in the group based on number of points scored by a conditional formula:
R1 * K1 (management budget) + R2 * K2 (training) + R3 * K3 (wage) = Score
Each of the factors has its own weight in calculation. Based on correlation analysis, we establish weight of coefficients and check distribution of recruited workers on several groups, as a result we obtain the following weight coefficients:
- Management budget - 0,15
- Training - 0,35
- Wage - 0,50
Random
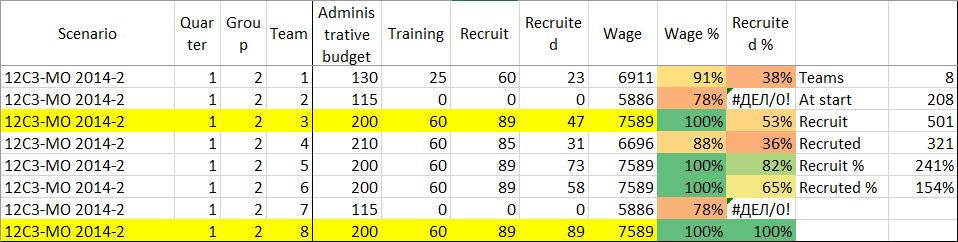
In example below, pair of commands with exactly same solution (yes, exactly the same) is highlighted with yellow. Number of recruited workers between teams differs by 2 times (47 and 89). In the same group, 2 more teams with the identical solution and number of recruited workers 58 and 73. It is obvious that if factors affecting the ranking of teams in calculating number of recruited workers are equal, than simulator will additionally include a random factor. For example, this may be one of the mechanisms for protecting simulator from the excessive number of recruited workers, with parameters being equal, because labor market is limited. In real game such case is excluded, unless of course this is not a team collusion, but remember about such situation.
Hints
- Wages (50%) - we remember that exactly half of the success in the objective of recruiting required number of workers is wages. It is important to take the 1 place in ranking of the average salary of single worker among companies in the group in order to maximize your chances. To do this, in 1 decision, you should set the maximum possible load of workers, this will raise average wage per 1 worker. It should be taken into account that hours worked + absenteeism/sickness hours can not exceed hours available. It is necessary to set load of workers in order to slightly exceed hours available. Next, it is necessary to determine the hourly wage rate should be minimum as possible, but sufficient to get into the leaders of the wage ranking. There is a small trick - it is important to remember that when decide about hourly wage rate, the absolute majority of teams usually indicate "beautiful" numbers that end by 0 or 5 (1210, 1215, 1220). You should specify hourly wage rate more by 1, for example (1211, 1216, 1221). This will give you opportunity to win a position in ranking with minimal costs.
- Management budget (15%) - for the same reason, management budget should not be 180, but for example 181 - i.e. more than 1, which is usually set by the majority of teams, this will give an opportunity to win a position when ranking by this factor.
- Training (35%) - similar to the management budget, we set training more for 1, for example 31, 36, 41. All other things being equal, you will always be higher in the ranking, you can hire more workers and, as a result, you will be more cost-effective.