Game mechanics - Demand elasticity
16.12.2014
We have already understood How to test demand factors, now lets look at basic principles of market mechanic in the GMC simulator. Experienced players know that impact of demand factors to increase sales of their products is very different between groups with weak and strong competitors. In first rounds of the championship experienced teams have not got worthy opponents in the group and sales go up the hill. But in semifinal weak teams eliminated and teams begin a persistent struggle for the leadership. In this case, if we make the same decisions as in first rounds, sales will grow less. That is because elasticity of the demand factors decreased, competition in the group became stronger. Why it happens and how to forecast sales in future periods?
Previously, we estimated elasticities for direct and corporate advertising. But elasticity of demand factors is not constant and depends on the strength of competitors in the group or total market share occupied by the companies. It means elasticity for elasticity of demand factors. Lets check price elasticity of demand in 1 period on scenario 12C1 and 12C3.
Scenario 12C1
In this table you can see price elasticities of demand for scenario 12C1 - relative % change in demand when price changes by 1%. For example, prices increasing for Product 1 in Internet by 1% will decrease demand by -2.175%. Data was found from multiple perfect tests and can be used unconditionally.
| Elasticity | Product 1 | Product 2 | Product 3 |
|---|---|---|---|
| EU | -3,186 | -1,927 | -2,449 |
| Nafta | -5,010 | -2,739 | -3,510 |
| Internet | -2,175 | -1,418 | -1,794 |
In this table sum of market shares of all companies according to marketing information in 1 period. Amount of shares for Product 1 in Internet is equal to 76.2%, which means that market is occupied 76.2% by your company and competitors in the group. Market shares may vary depending on level of competitors in the group. In tests elasticity of Product 1 in Internet ranged from 70% to 80%.
| Market shares | Product 1 | Product 2 | Product 3 |
|---|---|---|---|
| EU | 52,8 | 70,6 | 63,8 |
| Nafta | 40,5 | 69,1 | 58,9 |
| Internet | 76,2 | 84,6 | 81,8 |
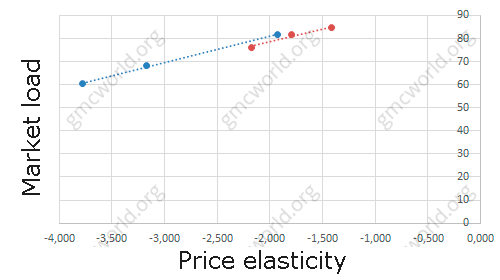
Lets put prices elasticity of demand and market shares on graph. In the graph vertically - market share (EU - blue, Nafta - green, Internet - red). Horizontal - price elasticity of demand in 1 period.
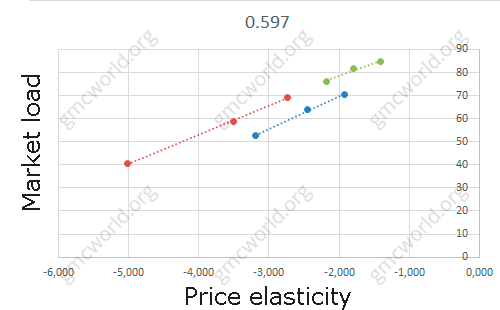
The higher market share, the lower price elasticity of demand. This means that the same price change (for example, decreasing by 5 units) in weak group with lower market share, you will get more demand growth than in the group with high market share.
Scenario 12C3
Lets do the same with price elasticity from scenario 12C3.
| Elasticity | Product 1 | Product 2 | Product 3 |
|---|---|---|---|
| EU | -6,372 | -6,527 | -3,400 |
| Nafta | -6,372 | -6,527 | -3,400 |
| Internet | -3,774 | -3,172 | -1,924 |
Sum of market shares of all companies according to marketing information in 1 period.
| Market load | Product 1 | Product 2 | Product 3 |
|---|---|---|---|
| EU | 20,6 | 20,1 | 49,9 |
| Nafta | 30,4 | 29,6 | 62,6 |
| Internet | 60,5 | 68,4 | 81,8 |
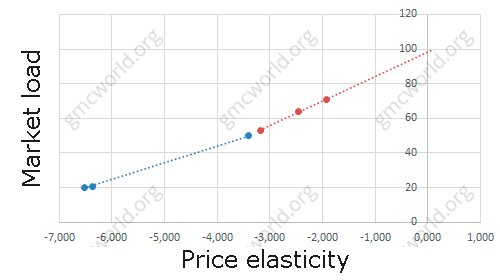
In the graph vertically - market load (EU - blue, Nafta - green, Internet - red). Horizontal - price elasticity in 1 period.
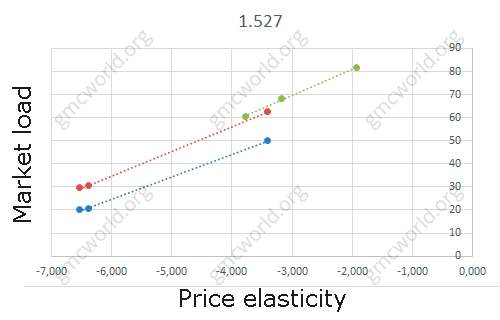
Analysis shows line points slight deviations from trend, market share also slightly differs between each other - the difference is about 5%, which is caused by average values of market shares in several test groups. We can conclude that market share in current period affects on demand factors in current period.
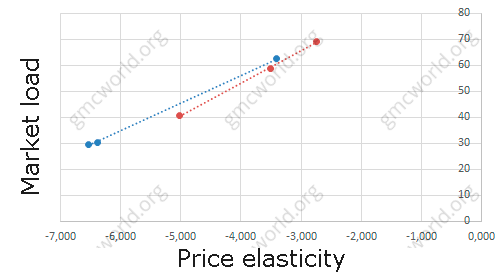
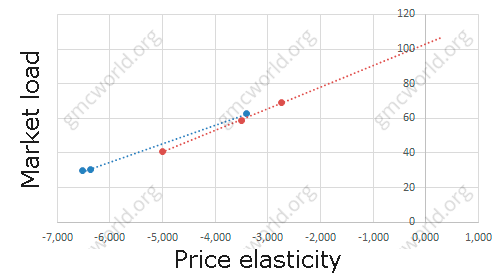
Compatible elasticity for each market from scenarios 12C1 and 12C3 on the same graph.
EU
Nafta
Internet
Taking into account estimate error of price elasticity and market load, there is no difference between scenarios. Elasticity is reduced in direct proportion to the market load. When you forecast sales, it is necessary to forecast market load changes to correct influence of demand factors.
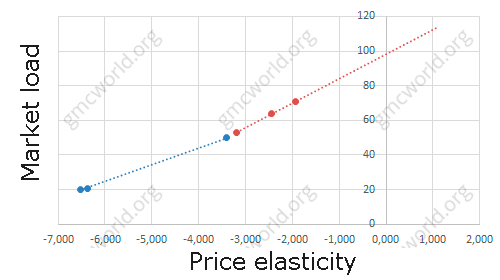
We extend trend line to the intersection with axis OY. Continue trend line from scenario 12C1 (red) as the most clearly calculated.
EU
Nafta
Internet
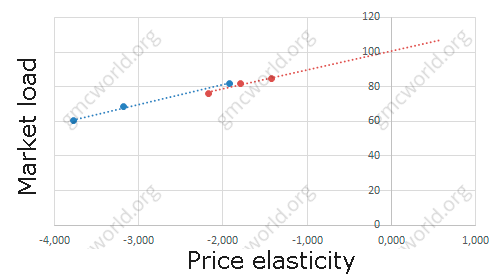
Trend line crosses axis OY at 100. That means when trend reaches 100% market share, elasticity drops to 0. So to go beyond 100% is impossible, it is a natural mechanism that limits market expansion in GMC simulator.
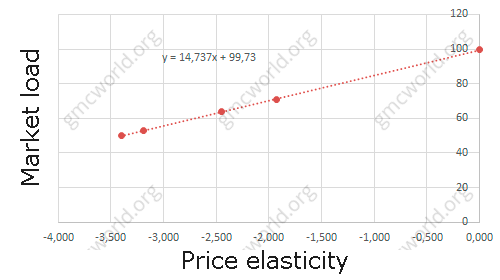
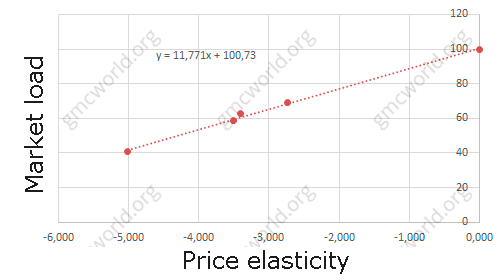
Calculate elasticity of price elasticity of demand for each market. For EU and Nafta I removed 2 points where was large error in estimation of market share. Add control point on axis OY - 0 elasticity, market load 100.
EU
Nafta
Internet
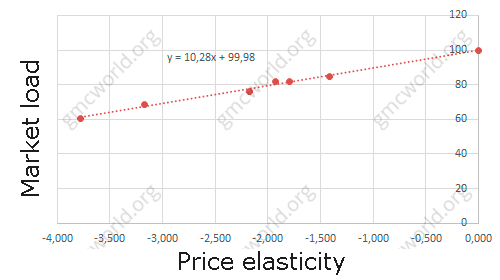
Elasticity of price elasticity of demand for Nafta and Internet market is about the same 11.77 and 10.28. While elasticity for EU market is much higher 14.73.
Hints
Elasticity of demand factors is directly proportional to the market share.
Automatic forecast of demand, taking into account the elasticity of demand factors from market share is built into the Calculation model, which can be purchased in our store.