Game mechanics - Maintenance map
24.10.2014
Maintenance (MT) is not the most expensive part in company budget, but can save a couple thousand with proper planning. To do this, you need to invest in maintenance as much - as you really need and no more.
I failed to find the exact dependence of the machines efficiency with MT, but by analogy with agents and distributors - recruitment map you can "draw" a map where you can visually see it. Machines efficiency in the next period depends on:
- Machines efficiency in current period.
- Normalized MT in current period - MT, purified from the influence of machines load and number of shifts. In fact it will MT for one machine at 100% load (5 days) with 1 shift.
Normalized MT = MT / Number of shifts / (Machine hours / Total possible machine hours * Coefficient)
Coefficient = ratio of total possible machines hours for 7 days to the same number of machines hours for 5 days. In old version of GMC simulator ratio is 1.4 to 1 shift and 1.3 to 2 or 3 shifts. In new version of GMC simulator ratio is 1.37 for 1 shift and 1.27 for 2 and 3 shifts.
We get clean MT time based on 100% machines load. Also take into account changes in machines efficiency because of purchasing new machines. If you sold some machines, this data is not considered. Formula for calculating the real machines efficiency after buying:
Real machines efficiency = (Machines efficiency in current period * Machines in current period - (Machines in current period - Machines in previous period) * 100) / Machines in previous period
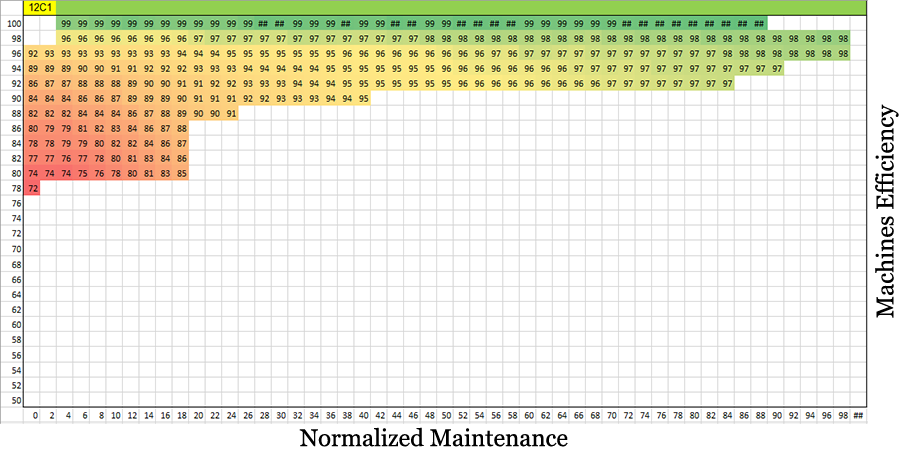
Map was made from large number of management reports and well demonstrates that formula of machines efficiency does not change between scenarios. Vertical - machines efficiency in previous period, horizontal - normalized MT in previous period, intersection - machines efficiency in current period.
Hint - optimal machines efficiency is achieved in the range 90-92%, the cost to achieve higher efficiency is not effective. In our Calculation Model v2 (pro version) we calculate optimal investments in MT for each scenario by every period. After trying all possible options you will find optimal MT plan. For example, in most cases, optimal plan for scenario 12C1 will look like:
- 1 period - 70
- 2 period - 50
- 3 period - 35
- 4 period - 25
- 5 period - 2
You can purchase Maintenance map for each scenario in our store.
Automatic forecast of machines efficiency is built into the Calculation model, which can also be purchased in our store.